-40%
ThinkorSwim RSI Bollinger Band Oscillator & Scan Indicator
$ 24.81
- Description
- Size Guide
Description
Bollinger Band Oscillatorhttps://www.youtube.com/watch?v=j2lsGILmErM
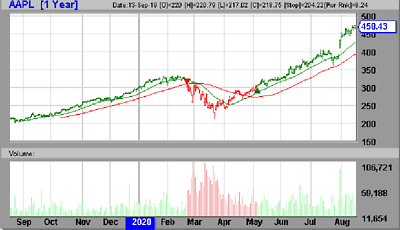
This is one of the most unique indicators ever created. I’ve always enjoyed using Bollinger Bands combined with the Relative Strength Indicator(RSI) for my trades, so I decided to combine them both into one powerful Oscillator. This Script I created has incredible accuracy: showing when the trending strength is beginning to change on a relative overbought / oversold level. In the pictures above you will see a GREEN ARROW built into the study. This arrow will show up when a few conditions are established. First: the RSI must cross above the lower bollinger band. Second: the upper bollinger band must be below the 20 level. Lastly: this must all take place at the same time. There is a lot that went into creating this thinkscript indicator.
This Indicator is for experienced traders only. All purchases are final, refunds not applicable. Once purchase is made within 24 hours of purchase you will be E-mailed the thinkscript for this study. You will also be E-Mailed the thinkscript scan for this study.
Disclaimer:
This indicator is for education only. In no way, shape or form is this indicator financial advice. The Future performance of this product is not and should not be taken as an indication of current of past performance.
Below are easy to follow picture examples for users on how to import the Bollinger Band Oscillator into the ThinkorSwim platform.
#1) Go to study’s
Click create.
#2) Remove text where it says NewStudy. Replace with BollingerBand_Oscillator.
Remove the text in the Thinkscript Editor Box that says “plot Data = Close; “
#3) Copy and Paste the BollingerBand_Oscillator Script you Purchased and Click OK.
#4) Click Apply
FINISHED!!!
Below are easy to follow picture examples for users on how to import the Bollinger Band Oscillator for SCAN importing.
#1) Go to Scan In Thinkorswim
#2) Click add study filter
#3) Click custom
#4) Click on ThinkScript Editor.
#5) Remove text in box.
#6) Paste the Scan Script you purchased into the box, and click OK.
#7) Click SCAN


